Survey dashboards give you powerful tools to analyze, compare, and export results from your individual surveys.
They provide a clear, interactive overview of your feedback data to help you gain meaningful insights.
You can access your dashboards from the navigation bar on the left-hand side of your screen.
Main Tab
-
View an overview of all results
-
Drill down into specific questions for deeper insights
-
Filter your data
- View comments
- Export dashboard results
Understanding dashboard tiles
The main tiles at the top of the dashboard show key metrics:
-
Number of invitations sent
-
Number of responses received
-
Response rate
-
Average rating (from star and grade questions)

Drill down into your questions
Click any rating or NPS tile to open a detailed view for that question.
This question-level dashboard includes:
-
Response count
-
Average score
-
Score distribution
-
Timeline trends
-
Related comments
You can also apply filters and download data from this view.
Comments
Below the question blocks, you will find a table showing all respondent comments.
Comments provide qualitative feedback and may relate to:
-
NPS questions
-
Rating questions
-
Open-ended questions
-
Multiple choice or Yes/No questions
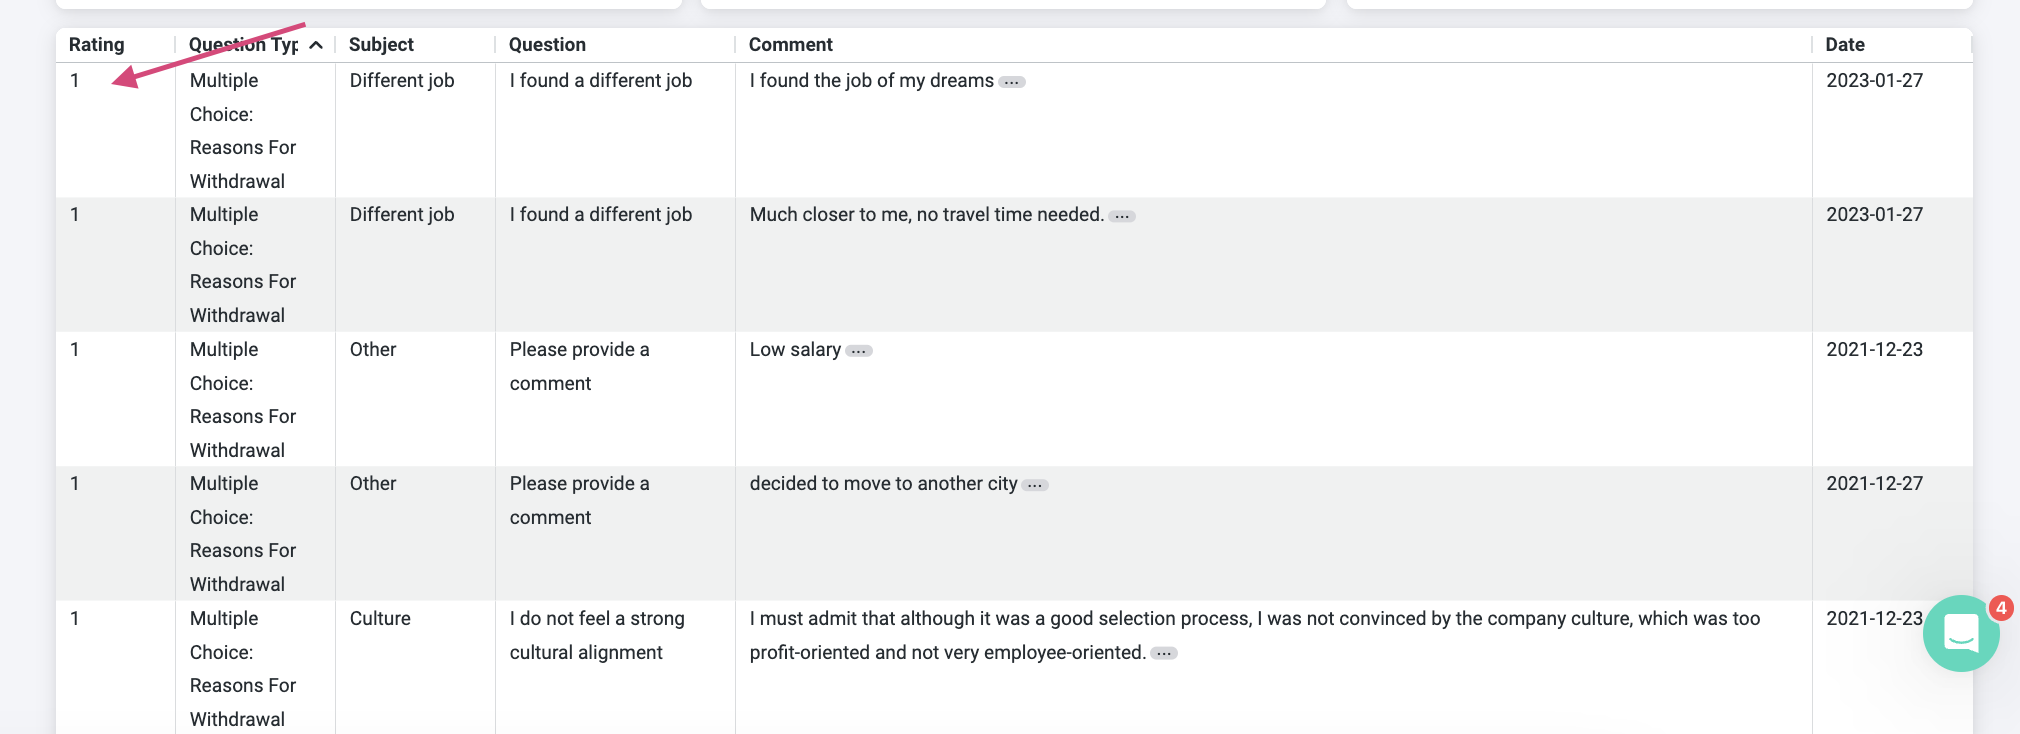
Each row displays the question, rating, subject, and date.
📗 For Multiple Choice and Yes/No questions, the “rating” reflects the selected option (for example, 1 = Yes, 0 = No). These responses do not affect average ratings.
📘 Click the three dots next to a comment to open the full response in a new tab. From there, you can view respondent details and contact them if needed.

Comparison Dashboard
Here you can compare results between departments, teams, or time periods.
- Add a filter to segment A
- Add a filter to segment B

- Watch the dashboard tiles populate with metrics based on the filters you applied
- Segment A is displayed in blue
- Segment B is displayed in grey

Matrix
The Matrix helps you quickly identify strengths, weaknesses, and improvement areas.
It works by calculating the impact of a particular aspect of your hiring process on the Net Promoter Score. This impact is stated as a correlation coefficient.
It is based on the correlation between your NPS score and the ratings received on other questions.

Understanding correlation
Correlation shows how closely an aspect and the Net Promoter Score (NPS) move together. It measures whether changes in one are related to changes in the other.
The correlation coefficient ranges from -1 to +1:
-
+1 = perfect positive correlation
-
-1 = perfect negative correlation
-
0 = no correlation
A positive correlation means both scores move in the same direction. When one increases or decreases, the other does the same.
A negative correlation means the scores move in opposite directions. When one increases, the other decreases.
A correlation of 0 means there is no relationship between the scores. Changes in one do not affect the other.
⚠️ Note: Correlation shows a relationship, but it does not prove that one factor causes the other.
For a more in-depth understanding of your Matrix, 📘 Learn about Starred's Matrix →
Responses Tab
Here you can:
-
open individual responses
-
export responses

👍 Use the dashboard filters and time range selectors to focus on specific groups or timeframes and uncover more detailed insights.
Viewing an individual response
To view an individual response:
-
click on the response
You can view more details about the response by clicking on the 3 vertical dots (⋮) .
From here you can:
-
view details (custom fields)
-
contact the respondent
- delete the response
- copy the link to the response

Exporting responses
From the Responses page you can export responses.
-
Click on the 3 horizontal dots on the top right of the page
-
Select Export to CSV.

FAQs about Survey Dashboards
How do I view the individual responses to my Employee Engagement survey?
In an Employee Engagement account you cannot access the individual response page for privacy reasons.
If you were able to see individual responses you'd also be able to see the custom fields of this respondent and you could figure out, from whom the feedback is coming.
If you need an export of your data you can reach out to us at support@starred.com and we'll explain what is possible.
Why can't I see a "Responses" tab in my dashboard?
The most common reasons are:
- You're part of a HR account in Starred, also known as Employee Engagement accounts. HR accounts do not have the option to see individual responses for reasons related to employees' privacy.
- Your user account does not have permissions to view individual responses. If you think this is a mistake, please reach out to your colleague who's also a Starred admin, so they can adjust the settings for you. 📘 Learn about user access rights →
I am unable to export my responses, the page keeps loading
There is a limit in exporting via our web-app, as the CSV export feature is not built for very big data-exports. If you're trying to export a big file it's possible that it won't work.
We recommend adding a date filter to limit the amount of responses per export (10k should do the trick).
If you do not think this is the issue, please reach out to us via the chat or at support@starred.com.
I got a few responses to my Employee Engagement survey, but I don't see any insights in the dashboard. Why?
If you're in an Employee Engagement account in Starred, the minimum number of responses you need for Starred to show data in the dashboard is 7. This is to protect your employees' privacy.
However, even when you have 7 responses, if your current respondents have skipped one of the questions, therefore only answering a few of your questions but not all of them, the total number of responses is still considered lower than 7, so you are not going to see results.
Feel free to reach out to us at support@starred.com if you think this explanation does not apply to your situation. We're happy to investigate further for you.
Why do I see a rating for my Multiple Choice questions in the comments box?
Respondents can leave comments to all questions, also ones where they are not asked to leave a rating, such as your Multiple Choice questions or Yes/No questions.
For those, you'll still see a "rating" listed in the table.
Please note that this is just a notation to identify the response given (for instance, for Yes/No questions 1 means Yes and 0 means No). Responses to Multiple Choice questions and Yes/No questions do not count towards your average rating.